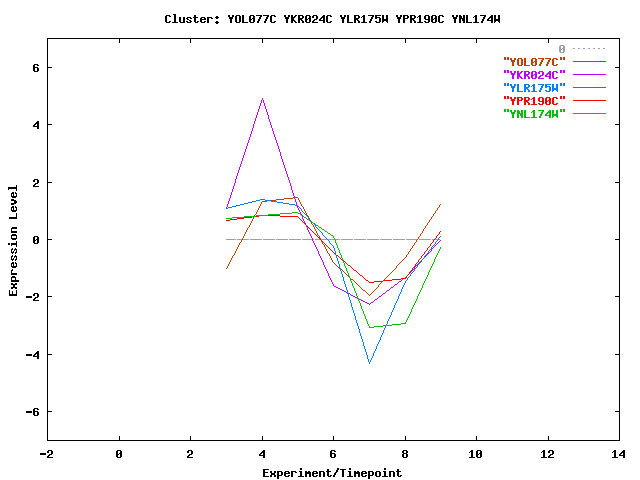
YOL007C is a somewhat unknown gene and YNL174W is a completely unknown gene.
By looking at the other three genes in this cluster and realize that they're
all involved in ribsomal production or assembly. Each plays a very specific
role in a large protein complex (the ribosome), but, ultimately, they are all
a part of the more general process of translation (the "conversion"
of mRNA to a protein.) Biologists already know that YOL007C is involved
in the production of the large ribosomal subunit, but it remains unclear where
or how it acts. But, if this gene is expressed in a manner similar to
YLR175W, perhaps we might investigate small nuclear ribonucleoproteins more
in depth. And, with gene YNL174W, whose function is completely unknown,
this cluster could be the beginning of its classification as a ribosomal protein
perhaps.
B. Here are a few genes that don't appear to have
similar expression patterns (in the heat shock 2 experiment) and don't cluster
together (at threshold =.70), but are all involved in heat response:
Gene
Function
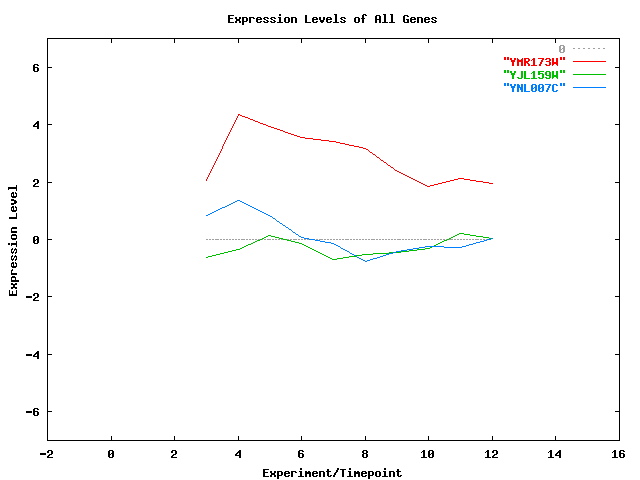
YMR173W:
DNA damage inducible; implicated in the production or recovery of mutations
(DNA
repair)
YNL007C:
sit4 suppressor, dnaJ homolog
(biological process unclear); translation heat shock protein, homolog of
E. Coli
Take-home message:
All these genes are heat shock proteins, so we might assume before examining
the expression data that they would be expressed at similar time points in response
to a heat stress. However, this is not entirely true. They do all
appear to peak at the beginning of the stress, but they peak at slightly different
time points and, certainly, at different quantities. They also decline
at different levels. At this point, a skeptical biologist might also consider
possible concentration or fluorescence differences among the samples.
For more information, please see the background information on gene
expression.
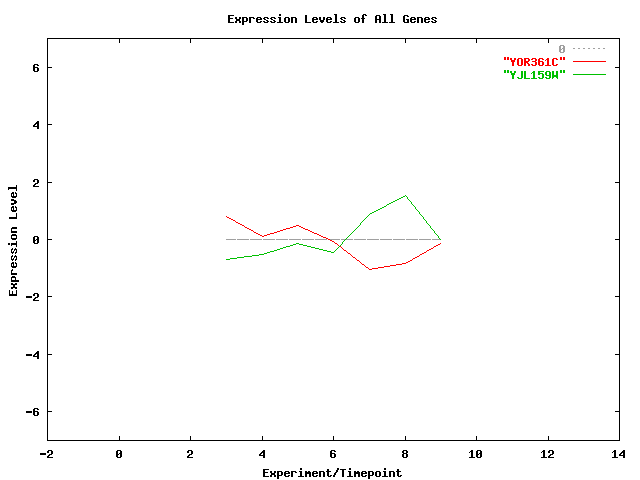
C. Here are two genes that seem to have reciprocal
expression patterns (heat shock 2):
Are these genes related? If they are reciprocally expressed could that
imply some sort of regulational relationship? YOR361C appears to be a
type of regulatory protein. Perhaps it is expressed in response to heat
stress to turn on genes that will repair heat shock damage. Then, they
continue to express in a sort of inverse relationship until the cellular problem
is fixed. However, a clustering program such as ours will not uncover
or examine these type of relationships, however important they could potentially
be. At least, not yet.
2.
Threshold values: What do they mean?
The default threshold value is 0.70 which means that the correlation
coefficients between clustered genes must be at least 0.70. If you raise
this value, you increase the requisite correlation coefficient thereby making
the "requirement" for clustering more stringent. The reverse is
true with lowering the threshold value. It is important to keep in mind
that lowering the threshold value to low will allow for genes that are not
similar to be clustered together. Conversely, an extremely high threshold
will exclude genes from clustering that are actually expressed similarly.
The selection of an ideal threshold is an age-old theoretical
ponderance. Theorists continue to debate the best possible method to
determine an appropriate threshold that will best represent real-world
relationships between genes. In other words, the best threshold value
would be one that accurately clustered together genes that are actually
expressed similarly in the cell while excluding genes that only are somewhat
similar in expression pattern, but not related. Of course, the
"paradox" ends on the note that all genes express differently and we
can't predict predict expressional relationships until we have a whole lot of
bench work to back up the large amounts of inferences we can begin to make with
microarrays and clustering.
3.
Caveats: Don't forget....
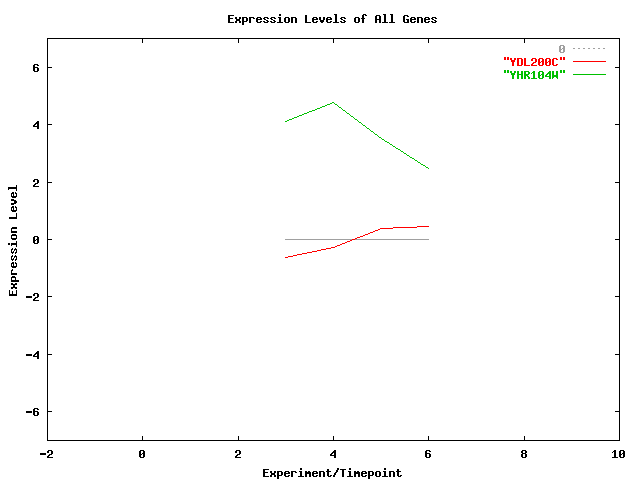
A. Time points vs. whole experiments:
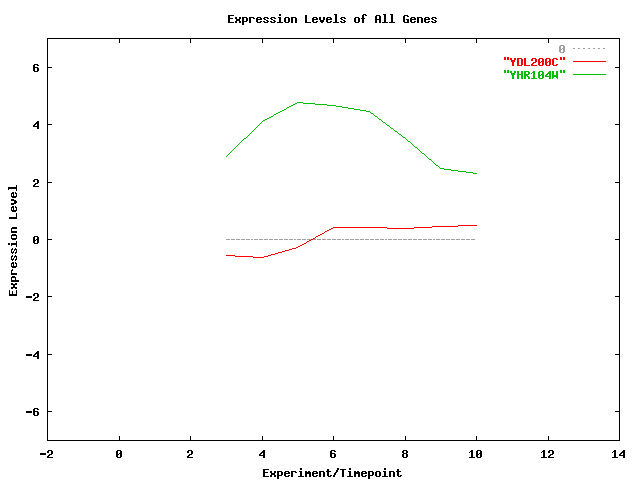
These two graphs compare these two genes between four time points (left) and
the entire experiment. It's really important to remember that the
selection of time points can bias the clustering results and take the expression
data "out of context" if done haphazardly. Also, the inferential
value of the graph on the left is much lower than the one on the left. The
progression of gene induction/repression over time is obviously dependent on
every time point. So, for the "big picture" view, keep in mind
the "select all time points" checkbox.
B. As you become more familiar
with the clustering program, it's pretty interesting to look at the description
of the genes and see how they vary across different experiments. For example,
a heat shock protein might be completely inactive in the hydrogen peroxide and
nitrogen depletion experiments, whereas the heat shock experiments are, not
surprisingly, bright red and green.
This
page was designed for an undergraduate course, Computational Biology, at Davidson
College.