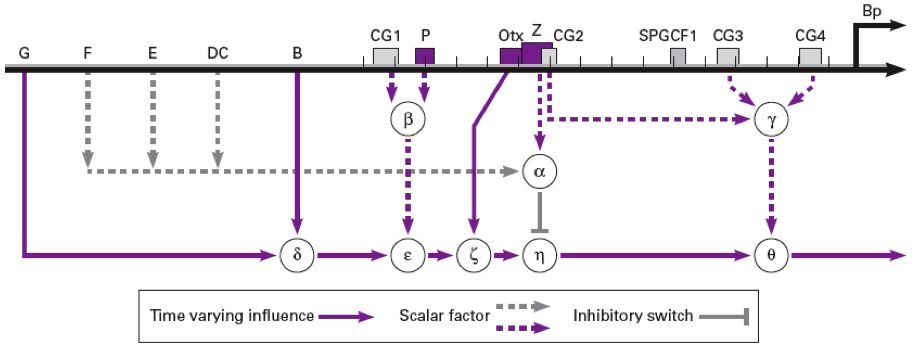
This web page allows you to explore Endo16 transcription in sea urchin. The gene network is illustrated in the below figure. This model of Endo16 is an implementation of the algorithm in Yuh, Bolouri and Davidson.
To compute the Endo16 transcription level, check the boxes next to elements of the network that are active under the conditions you want to model. Fill in the boxes next to variables B, G, and Otx with the appropriate values, then hit Submit.
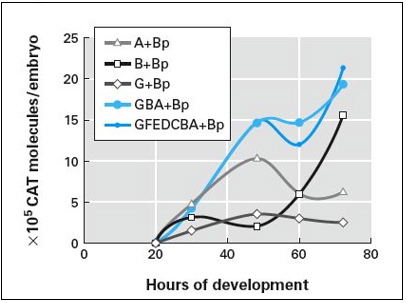
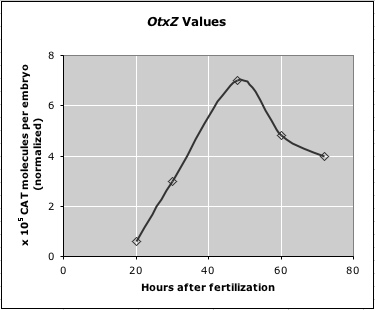
Use the graph on the left (Figure 10.12a from the text) to determine appropriate values for B (B+Bp) and G (G+Bp), and to check the final output (Theta in Table 10.3; GBA+Bp in Figure 10.12a). Use the graph on the right to determine appropriate values for Otx (OtxZ) at a particular time. (This graph is Figure 10.19a, normalized to match values in Figure 10.12a.)
 |
 |
Perl script for this page (see Math Minute 10.1 for explanation)
References
Campbell, A. M. and L. J. Heyer. 2006. Discovering Genomics, Proteomics and Bioinformatics, 2nd Edition. Benjamin Cummings and Cold Spring Harbor Press.
Yuh, C. H., H. Bolouri, and E. H. Davidson. 1998. Genomic cis-regulatory logic: Experimental and computational analysis of a sea urchin gene. Science. 279: 1896–1902.
Yuh, Chiou-Hwa, and Eric Davidson. 1996. Modular cis-regulatory organization of Endo16, a gut-specific gene of the sea urchin embryo. Development. 122: 1069–1082.