There are many possible answers to this question.
First, note that if you did not used the supplied grid files, your plots my look slightly different from those shown below, and individual genes' ratios may be quite different from those shown below. This is because ratios are sensitive to how well-centered the spots are within the grid squares. Therefore, ratios can vary significantly from grid to grid when the spots are not uniformly spaced or the rows and columns are crooked, making it difficult to center the spot
It's a good idea to look at more than one gene for which two methods result in different ratios. The more you experiment with these "outliers," the better you will understand the many issues that are involved in microarray image analysis. Issues you might explore include the following:
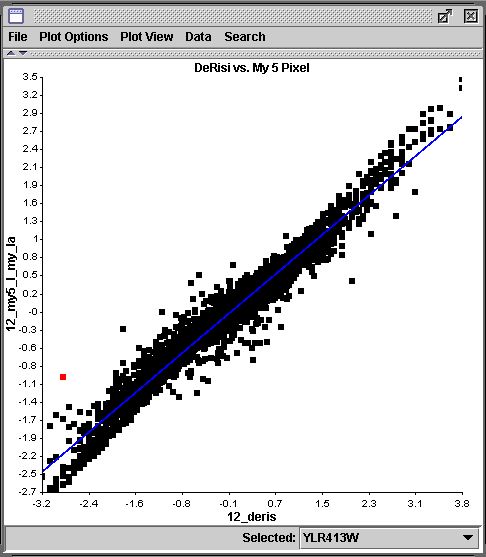
One apparent outlier in the 5 pixel vs. DeRisi comparison is YLR413W, shown highlighted below:
Moving to the 3 pixel vs. DeRisi plot and highlighting the same gene gives the following:
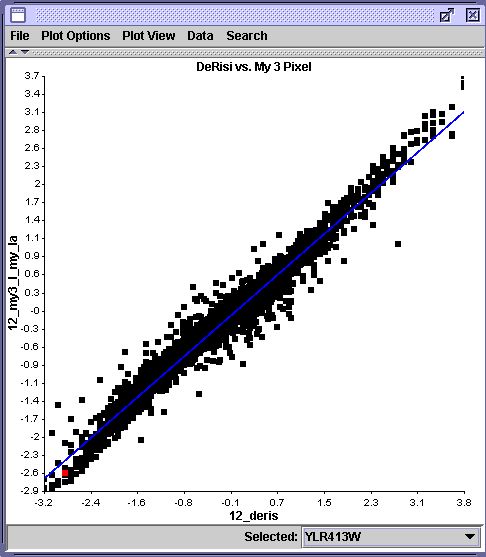
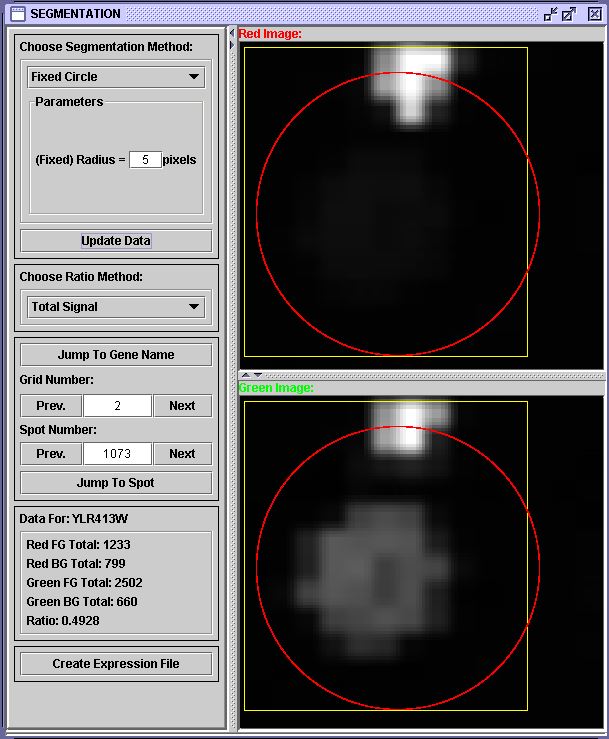
The 5 pixel segmentation seems to be more like the DeRisi result. However, the 3 pixel segmentation is likely the most accurate, because a 5 pixel radius circle includes the noisy region at the top of the grid square in both images. The segmentation snapshot below shows the inclusion of the noise.
 |
 |
 |
||
![]()
![]()
© Copyright 2004 Departments of Mathematics & Biology, Davidson College, Davidson, NC 28035
Send comments, questions, and suggestions to: laheyer@davidson.edu or macampbell@davidson.edu