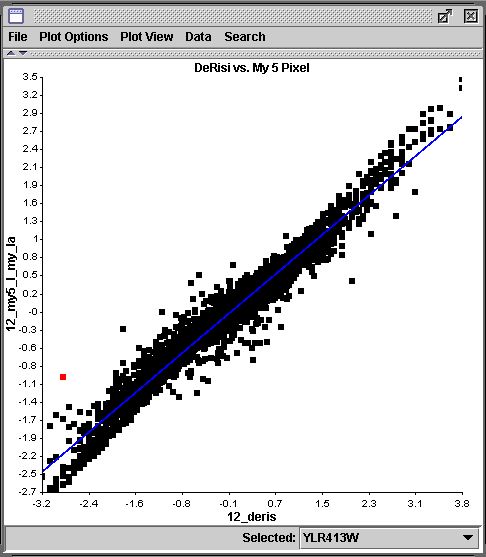
The data should be log transformed so that outliers on both the induction and repression end of the scale are comparable on the plot. The following plots illustrate this point. First, recall the plot highlighting the outlier YLR413W:
Now see what this outlier looks like in non-log transformed data. Would you have picked it out?

 |
 |
 |
||
![]()
![]()
© Copyright 2004 Departments of Mathematics & Biology, Davidson College, Davidson, NC 28035
Send comments, questions, and suggestions to: laheyer@davidson.edu or macampbell@davidson.edu