A quick perusal of the file yeastinfoNew.info will help you determine that ribosomal genes, both those in the cytoplasm and those in mitochondria, have the word "ribosomal" in the Cellular Component column. The first step is to select all of these ribosomal genes.
In the Exploring DeRisi_i popup window, select the button "Find Genes Matching Criteria..."
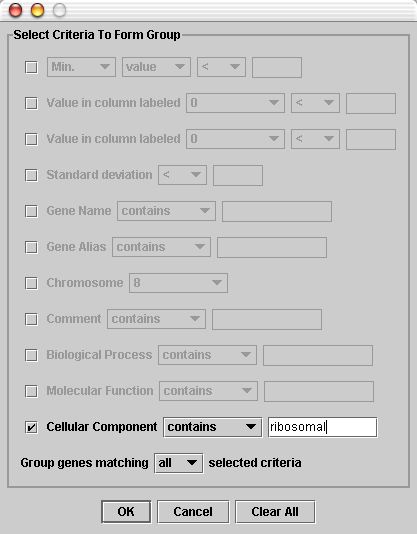
Fill out the criteria as shown in the screen shot below, which checks for the word "ribosomal" in the cellular component.
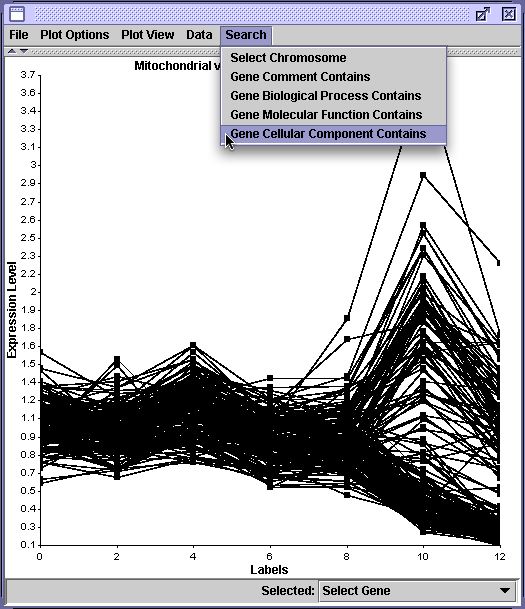
This search finds 183 genes meeting the desired criterion. Plot these genes as a group. In the plot window, under the Search menu, select the "Gene Cellular Component Contains" option, as shown below.
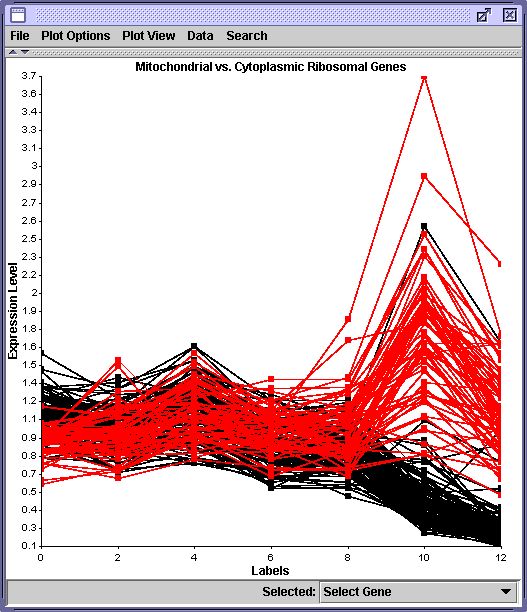
In the window that pops up, type "mitochondria" and hit return. The result is the following plot, showing expression profiles (non-log transformed) for all 183 ribosomal genes over the entire time course, with the mitochondrial ribosomal gene highlighted in red. Here we see the qualitative difference between the expression profiles of the two classes of ribosomal genes: those in the mitochondria were generally induced, while those in the cytoplasm were generally repressed.
 |
 |
 |
||
![]()
![]()
© Copyright 2004 Departments of Mathematics & Biology, Davidson College, Davidson, NC 28035
Send comments, questions, and suggestions to: laheyer@davidson.edu or macampbell@davidson.edu