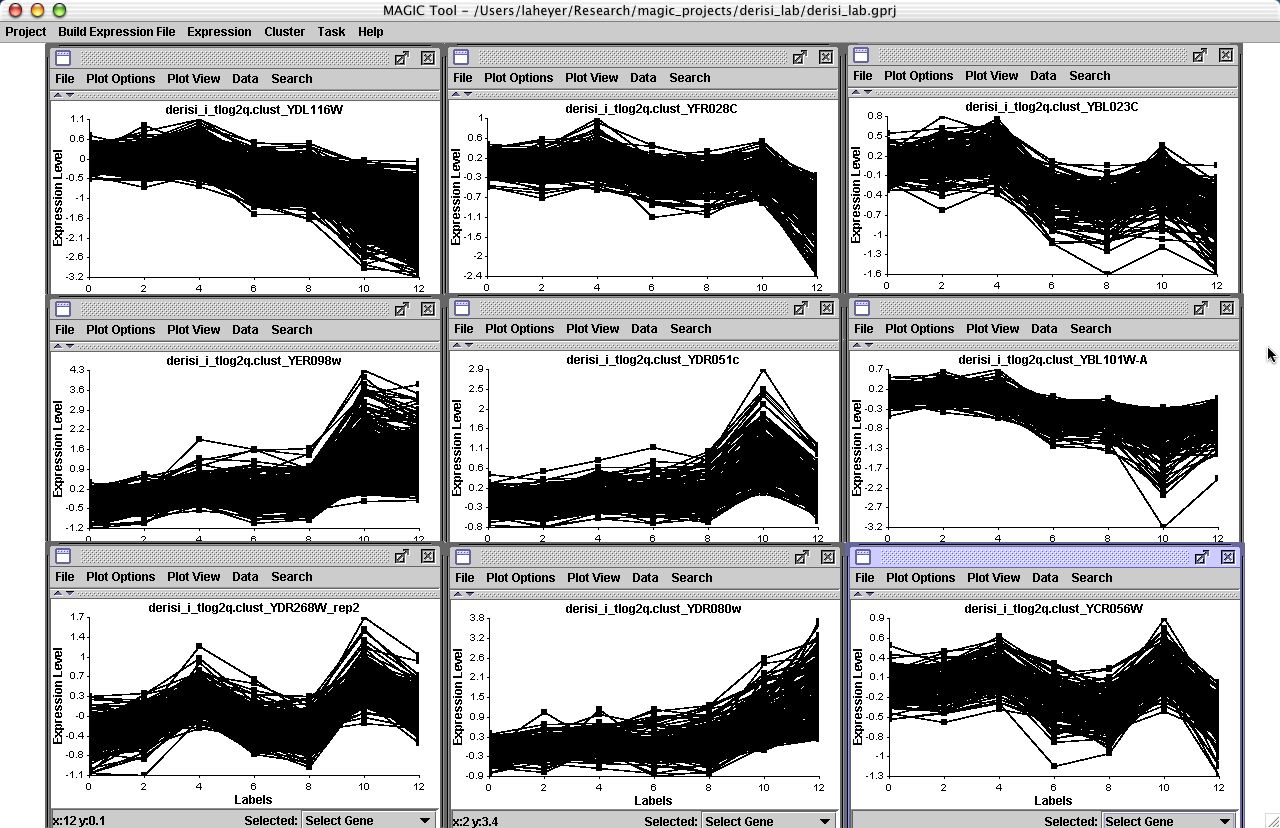
The first 9 clusters identified with QT Clust, using a threshold of 0.3, are shown below. Several "signature" patterns can be seen in these clusters, including some shown in Figs 4 and 5. This display was formed by using the "List" option from the Cluster Display popup window, then clicking on each gene on the left in turn and selecting "Plot Cluster as a Group."
 |
 |
 |
||
![]()
![]()
© Copyright 2004 Departments of Mathematics & Biology, Davidson College, Davidson, NC 28035
Send comments, questions, and suggestions to: laheyer@davidson.edu or macampbell@davidson.edu