Ideally, all ratios at this timepoint should be 1.0; however, because of random effects and experimental error there is a distribution of values around 1.0. This "noise" is inherent in all microarray studies, but can be controlled and quantified through careful experimental design and data analysis. The fact there are 32 genes "off" by at least a factor of 2 when there has been no growth suggests that the 22 genes is indeed a small number to have changed by at least a factor of 2 after two hours of growth.
In the Exploring DeRisi_i popup window, select the button "Find Genes Matching Criteria..."
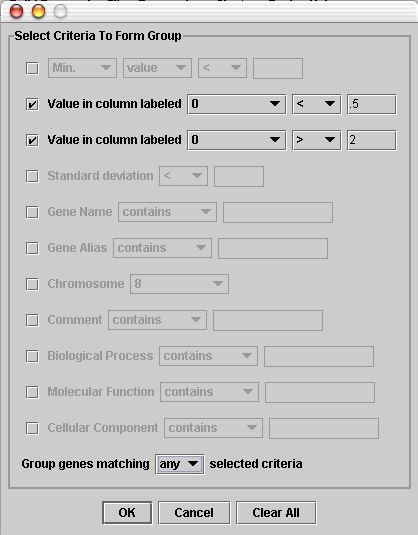
Fill out the criteria as shown in the screen shot below, which checks for a factor of 2 induction or repression in the initial time point of the diauxic shift experiment.
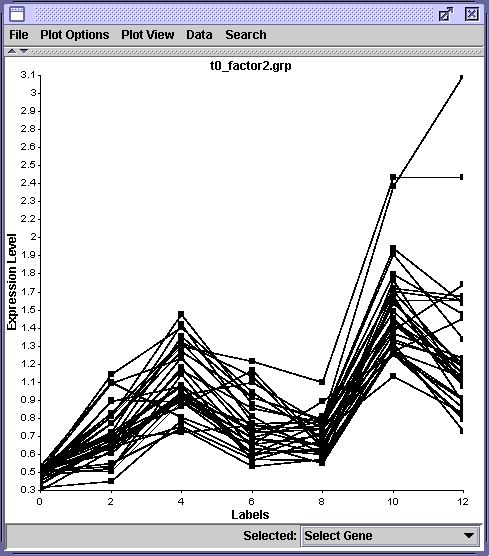
This search finds 32 genes meeting the desired criterion. Surprisingly, all 32 genes are identified for a ratio less than 0.5, rather than a ratio greater than 2.0. Even more surprisingly, the expression profiles of these 32 genes are remarkably similar across all timepoints of the diauxic shift experiment. The following plot shows the expression profiles for these 32 genes over the entire time course. (Note that these profiles have not been log transformed.)
 |
 |
 |
||
![]()
![]()
© Copyright 2004 Departments of Mathematics & Biology, Davidson College, Davidson, NC 28035
Send comments, questions, and suggestions to: laheyer@davidson.edu or macampbell@davidson.edu