Difference between revisions of "Eric"
(→Genes in depth) |
(→Genes in depth) |
||
| Line 119: | Line 119: | ||
==Genes in depth== | ==Genes in depth== | ||
| − | Dyrk1a- related to many down syndrome symptoms and phenotypes <br> | + | [https://en.wikipedia.org/wiki/DYRK1A '''Dyrk1a''']-related to many down syndrome symptoms and phenotypes <br> |
[https://www.ncbi.nlm.nih.gov/pubmed/28250274 Alzheimer's] | [https://www.ncbi.nlm.nih.gov/pubmed/28250274 Alzheimer's] | ||
[https://academic.oup.com/hmg/article-lookup/doi/10.1093/hmg/ddw309 Using Epigallocatechin-3-gallate treatment to correct some craniofacial features] [https://en.wikipedia.org/wiki/Epigallocatechin_gallate EGCG] | [https://academic.oup.com/hmg/article-lookup/doi/10.1093/hmg/ddw309 Using Epigallocatechin-3-gallate treatment to correct some craniofacial features] [https://en.wikipedia.org/wiki/Epigallocatechin_gallate EGCG] | ||
Revision as of 14:57, 14 March 2017
January 19th Lab Methods in Genomics
http://bio.davidson.edu/Courses/Bio343/LabMethods_2017.html
Ts65DnDown Syndrome mouse model
T1DS/T2N -twin 1 down syndrome/twin 2 normal
MZ1/MZ2
-supernumerary
RPKM-reads per kilobase million -gives you a normal for comparison
LADs are overtranscribed in down syndrome when they should have low expression
Think replication time and transcription levels are correlated, genes transcribed earlier are expressed lower and later transcribed are more expressed
Not just the overexpression of chromosome 21. It is the consequence of these products causing the LADs to be expressed higher. Effects of changing chromatin structure
1/31
Molecular characterization of Ts65Dn
Ts65Dn is the mouse model for trisomy 21 in humans
distal= further away from the centromere
Think that chromosome 16 and 17 were combined via NHEJ but there is a small overlap region of 7 bp that might have had a role in determining the 16/17 breakpoint
writing as an introduction, not necessarily concerned with what we're going to do in the future
2/2
We are examining cDNA from the mouse models ~20 million reads per file
Separate each read based on barcode=3x nucleotide at end of chain
Trimmomatic used to delete barcode
use RSEM to map reads to genes and counts how many reads an identified gene is counted
DEseq2- enter name of data then click which data you want and run by execute
2/7
Use gene plot in galaxy after running DEseq 2. look for outliers and to search genes, use http://www.informatics.jax.org/batch/summary and delete decimals from gene number
disomic vs trisomic-looking for differences in expression, gene names, fold change=look at log2(FC), wald stats used to sort, base mean=reads per kilobase million
Which dataset is numerator?-first data set is numerator and second is denominator
Want to generate KEGG pathway maps for genes of interest, not looking at methylation differences, cant do with this data. We are looking at differential expression. Maternal Cont compared to Maternal Ts65Dn
to remove decimals in excel =left(A1, 18)
Save tab files as opening in excel and use excel to sort and whatnot. p-value cutoff=0.05 adjusted p-values are adjusted for the multiple tests that are performed
We will use the p-values with a value of less than 0.0001. This provides 105 genes of interest in the dataset of maternal trisomic vs maternal disomic
We took the genes and ran them through the naming program and export to excel
2/9/17
gene interaction tool
Sorted genes of interest by chromosome location
log2(FC)= 2^that number = how much more expressed gene is
Filtered dataset by p-value of less than 0.0001 using workflow in galaxy, then sorted these data on log2(FC) greater than abs(.5)-using workflow to add filters and trims, etc.
2/16-working with visualizations in galaxy and after having found genes of interest, we are looking through these genes, trying to hone in on a few. We are using the p-values and fold change to determine which genes are expressed differently in the trisomic vs disomic
also, how do we get rid off the control variables between maternal and paternal
We are comparing Disomic maternal vs disomic paternal first to get a baseline difference in source dna and expression levels. Then we are comparing Trisomic maternal vs trisomic paternal to find differently expressed genes between these two. The next comparison will be between the Trisomic comp vs disomic comp to eliminate any differently expressed genes due to simply maternal vs paternal sources. setting our baseline from the disomic comparisons. We also will compare trisomic maternal to disomic maternal and trisomic paternal to disomic paternal
https://www.ncbi.nlm.nih.gov/pubmed/27243896
https://www.ncbi.nlm.nih.gov/pubmed/27538963
https://www.ncbi.nlm.nih.gov/pubmed/27029737
filter 1:c6<0.0001 filter 2: c3>=0.5 or c3<=-0.5 trim: column 1 everything to 18
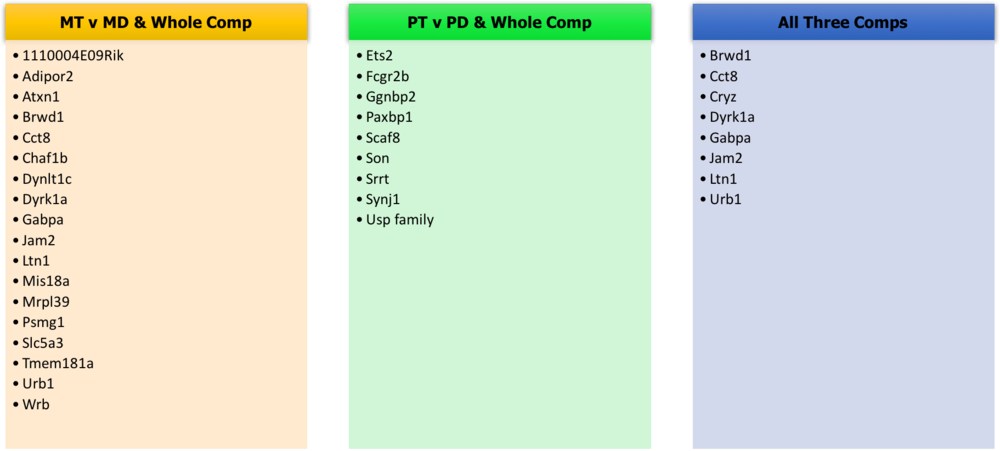
Compared Trisomy maternal vs trisomy paternal, this resulted in 99 differently expressed genes, 10 of which were also differently expressed in the trisomy maternal vs disomic maternal. The whole dataset of trisomic paternal and maternal was run against the disomic maternal and paternal
could use two sample t test or one sample to explore stats of these differences between trisomic maternal and paternal and trisomic vs disomic
Genes that were found in all 3: Brwd1 Cct8 Cryz Dyrk1a Gabpa Jam2 Ltn1 Urb1
3/14/17- for individual status report: rewrite intro based on feedback, write what methods you've done, dont focus on discussion, discuss results you have. lots of visuals and data and be able to explain figures and data
Genes in depth
Dyrk1a-related to many down syndrome symptoms and phenotypes

Alzheimer's
Using Epigallocatechin-3-gallate treatment to correct some craniofacial features EGCG
cancer resistance
target for chemotherapy
growth issues in DS

