Mathematical Models
Mathematical modeling is an important component in the construction of rationally designed gene networks. The complexity of biological systems makes necessary the use of sophisticated mathematical models to accurately predict network functionality. Models are useful in tuning the individual components of a network to increase system robustness. They also provide a basis for comparison of experimental results with expected results, allowing researchers to test the validity of their assumptions.
Modeling Transcription Rates
Note: the following mathematical analysis was developed based on a summary of the input function of a gene in An Introduction to Systems Biology: Design Principles of Biological Circuits (Alon, pgs. 241-250).
When dealing with gene activation and repression networks, such as those described in the common Biological Designs for synthetic cellular memory section of this paper, mathematical models are mainly used to model the transcription rate of a gene(s). Three common models that describe transcription rate as a function of repressor or activator are, in order of increasing complexity, the Michaelis-Menten model, the Hill model, and the Monod-Wymann-Changeux model. Each of these models builds on the one preceding it to paint a clearer picture of how binding occurs between two or more molecules and how that binding affects transcription rates.
The Hill equation is used most often to model cellular memory networks. In order to describe how the Hill equation works, it is first helpful to examine a simpler model. Based on the two biological designs presented in the previous section, it can be reasoned that to mathematically model these designs, we must be able to describe the effect of repressor/promoter binding on transcription rates (for mutual repression designs) and the effect of activator/repressor binding on transcription rates (for autoregulatory positive feedback designs). The two binding equations presented below do just that.
Repressor/Promoter Binding
Let's start by looking at the effect of repressor/promoter binding on transcription rate. The starting point for this proof is the dissociation constant for promoter and repressor binding. This constant, Kd, measures the tendency for a repressor/promoter complex to fall apart into its two separate subunits. The value of Kd is determined by the binding affinity of the two molecules and is written as:

where [P] represents the concentration of unbound promoter, [R] represents the concentration of unbound repressor and [PR] represents the concentration of promoter/repressor complexes. Our goal from here is to derive an equation that gives the probability of unbound promoter as a function of [R]. Because the probability of unbound promoters (or, said differently, the percentage of promoters that are not bound to a repressor) is proportional to the rate of transcription, we can easily modify the equation to give us the transcription rate as a function of [R] by multiplying by the maximal rate of transcription.
We can modify the equation above by substituting [Ptotal] - [P] for [PR] because the concentration of unbound promoter plus the concentration of bound promoter equals the total promoter concentration:

Using simple algebra, we can now solve for the probability of unbound promoter as a function of [R]:

Multiplying by the maximal rate of transcription, M, will yield an equation for transcription rate as a function of repressor concentration:

Based on the equation above, it can be seen that the dissociation constant, Kd, equals the repressor concentration at which the transcription rate is half of its maximal value. The value of Kd can, therefore, easily be determined experimentally.
Activator/Repressor Binding (The Michaelis-Menten Equation)
In order to describe transcription rates of an autoregulatory positive feedback system, we must look at the effect of activator/repressor binding on promoter activity. This proof works much in the same way as the repressor/promoter binding equation and it will lead us in the end to the Michaelis-Menten equation. We will start with the dissociation constant, Kd, for activator/repressor binding:

Here, [R] represents the concentration of unbound repressor, [A] represents the concentration of unbound activator and [RA] represents the concentration of repressor/activator complexes. Instead of solving for the probability of unbound promoter as a function of repressor (as we did above), we now need to solve for the probability of bound repressor as a function of activator concentration. Once again, the probability that a repressor is bound to an activator is proportional to the rate of transcription and can be modified to describe promoter activity as a function of [A] by multiplying by the maximal rate of transcription.
We can modify the equation above by substituting [R] for [Rtotal] - [RA] because the concentration of unbound repressor is equal to the total concentration of repressor minus the concentration of bound repressor:

Using simple algebra once again, we can solve for the probability of bound repressor as a function of [A]:

Multiplying by the maximal rate of transcription, M, will yield an equation for transcription rate as a function of activator concentration:

This equation is known as the Michaelis-Menten equation. Once again, it is true that the dissociation constant, Kd, equals the activator concentration at which the transcription rate is half of its maximal value. The value of Kd can, therefore, easily be determined experimentally.
The Hill Equation
For both of the equations derived above, it can be reasoned that when high levels of repressor or activator are in their respective systems, the rate of change in transcription rate is relatively low. This is the result that we would expect, because at high levels of repressor or activator, the systems would become saturated and would be minimally affected by the addition of more repressor or activator. Unfortunately, the above equations do not accurately depict many systems when repressor or activator concentrations are low. This is because of the tendency of transcription factors to be composed of multiple subunits. While a single subunit (a monomer) can bind to its target molecule by itself, in order to achieve maximal binding affinity, it is often the case that multiple subunits (dimers, tetramers, etc.) are required. This phenomenon is referred to as the cooperativity of binding because it refers to multiple activator or repressor subunits working together to bind as tightly as possible. The equations above do not take cooperativity into account, however, the Hill equation modifies them so that cooperativity can be included in the description of binding.
To do this, each equation above that yields the probability of the promoter being unbound by repressor (the third equation for each proof), is raised to the nth power, where n is the number of subunits involved in cooperative binding (the Hill coefficient). The equations are then multiplied by the maximal rate of transcription, M, yielding the Hill equations and graphs shown below.
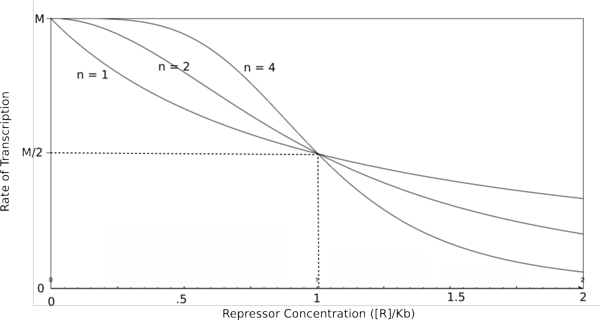 Graph of the Hill equation for a repressor with Hill coefficients of 1, 2, and 4.  Equation 1: The Hill equation for a repressor. M is the maximal rate of transcription, [R] is the concentration of unbound repressor, K d is the dissociation constant and is equal to the repressor concentration that yields half the maximal transcription rate, and n is the Hill coefficient. Error creating thumbnail: Unable to save thumbnail to destination
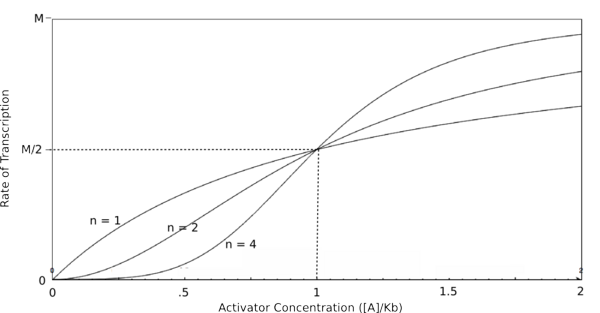 Graph of the Hill equation for an activator with Hill coefficients of 1, 2, and 4.  Equation 2: The Hill equation for an activator.M is the maximal rate of transcription, [A] is the concentration of unbound activator, K d is the dissociation constant and is equal to the activator concentration that yields half the maximal transcription rate, and n is the Hill coefficient. Error creating thumbnail: Unable to save thumbnail to destination
In the graphs above, three things should be noted. First, when Kb is equal to [R] or [A] (meaning that [R]/Kb or [A]/Kb equals 1), the rate of transcription is equal to half of the maximal value (M/2). This trend is denoted by the dotted line. Second, graphs of activators and repressors with a Hill coefficient of 1 are described by the Michaelis-Menten model (not taking cooperativity into account). Therefore, the Hill equation curves for n = 1 also represent the curves for the two relatively simple equations derived earlier in this section. Third, as n increases, the curves develop more and more sigmoidal (S-shaped) character, where the curves converge to two different values asymptotically. In the next section, this sigmoidal shape will be shown to be crucial in the establishment of bistability in a memory network.
The Monod-Wymann-Changeux Equation
It should be noted briefly that, while the Hill equation does account for cooperativity, it is not always the most accurate description of these types of biological systems. The Monod-Wymann-Changeux model improves on the Hill equation by taking into account a decrease in the dissociation constant as more repressor or activator subunits are bound onto a given complex. This model, however, is not frequently used in modeling synthetic cellular memory networks, where the Hill equation appears to suffice.
Cooperativity and Bistability
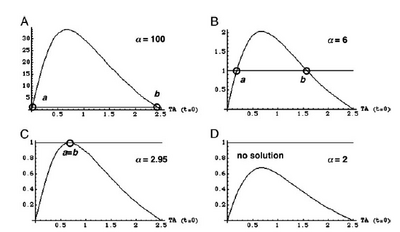
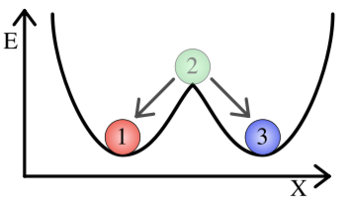 Balls marked "1" and "3" are in the two stable positions (This image was taken from wikipedia) Both the mutual repression and the autoregulatory positive feedback designs rely on the existence of bistability in their respective systems. Bistability refers to the existence of two local minima, towards which all states of a system converge. In the illustration to the right, a ball will wind up in one of the two stable states regardless of its initial state. In a similar manner, synthetic cellular memory networks are designed to create two stable steady states, the "on" and the "off" state. All cells must exist in one of these two states or else be in the process of moving between them. In the Biological Designs section, this idea was explained in general terms. Here, we will look briefly at the mathematics behind the development of bistability in cellular memory networks.
Using the Hill equations above to describe the rates of protein synthesis based on different levels of repressor/activator and ,
Determining the Values of Funcational Parameters
Put text here.
Error creating thumbnail: Unable to save thumbnail to destination
Quantitative Part Characterization
Put text here.
Error creating thumbnail: Unable to save thumbnail to destination
<Previous Section | Next Section>
|


