Difference between revisions of "CellularMemory:Mathematical Models"
Wideloache (talk | contribs) (→<center>Modeling Transcription Rates</center>) |
Wideloache (talk | contribs) (→Cooperativity and Bistability) |
||
| (11 intermediate revisions by the same user not shown) | |||
| Line 40: | Line 40: | ||
Here, [R] represents the concentration of unbound repressor, [A] represents the concentration of unbound activator and [RA] represents the concentration of repressor/activator complexes. Instead of solving for the probability of unbound promoter as a function of repressor (as we did above), we now need to solve for the probability of bound repressor as a function of activator concentration. Once again, the probability that a repressor is bound to an activator is proportional to the rate of transcription and can be modified to describe promoter activity as a function of [A] by multiplying by the maximal rate of transcription. | Here, [R] represents the concentration of unbound repressor, [A] represents the concentration of unbound activator and [RA] represents the concentration of repressor/activator complexes. Instead of solving for the probability of unbound promoter as a function of repressor (as we did above), we now need to solve for the probability of bound repressor as a function of activator concentration. Once again, the probability that a repressor is bound to an activator is proportional to the rate of transcription and can be modified to describe promoter activity as a function of [A] by multiplying by the maximal rate of transcription. | ||
| − | We can modify the equation above by substituting | + | We can modify the equation above by substituting [R<sub>total</sub>] - [RA] for [R] because the concentration of unbound repressor is equal to the total concentration of repressor minus the concentration of bound repressor: |
[[Image:RA2.png|200px]] | [[Image:RA2.png|200px]] | ||
| Line 56: | Line 56: | ||
==The Hill Equation== | ==The Hill Equation== | ||
| − | For both of the equations derived above, it can be reasoned that when high levels of repressor or activator are in their respective systems, the rate of change in transcription rate is relatively low. This is the result that we would expect, because at high levels of repressor or activator, the systems would become saturated and would be minimally affected by the addition of more repressor or activator. Unfortunately, the above equations do not accurately | + | For both of the equations derived above, it can be reasoned that when high levels of repressor or activator are in their respective systems, the rate of change in transcription rate is relatively low. This is the result that we would expect, because at high levels of repressor or activator, the systems would become saturated and would be minimally affected by the addition of more repressor or activator. Unfortunately, the above equations do not accurately describe many systems when repressor or activator concentrations are low. This is because of the tendency of transcription factors to be composed of multiple subunits. While a single subunit (a monomer) can bind to its target molecule by itself, in order to achieve maximal binding affinity, it is often the case that multiple subunits (dimers, tetramers, etc.) are required. This phenomenon is referred to as the cooperativity of binding because multiple activator or repressor subunits are working together to bind as tightly as possible. The equations above do not take cooperativity into account, however, the Hill equation modifies them so that cooperativity is included in the description of binding. |
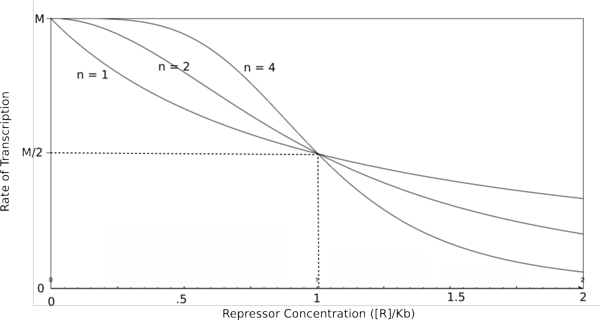
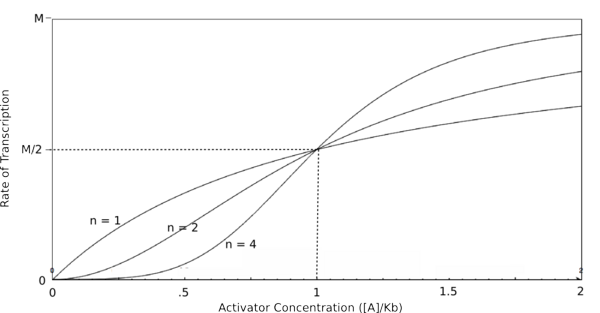
To do this, each equation above that yields the probability of the promoter being unbound by repressor (the third equation for each proof), is raised to the nth power, where n is the number of subunits involved in cooperative binding (the Hill coefficient). The equations are then multiplied by the maximal rate of transcription, M, yielding the Hill equations and graphs shown below. | To do this, each equation above that yields the probability of the promoter being unbound by repressor (the third equation for each proof), is raised to the nth power, where n is the number of subunits involved in cooperative binding (the Hill coefficient). The equations are then multiplied by the maximal rate of transcription, M, yielding the Hill equations and graphs shown below. | ||
| − | [[Image:HillRepgraph.png|thumb|left|600px|'''Graph of the Hill equation for a repressor with Hill coefficients of 1, 2, and 4.''']][[Image:HillRep.png|thumb|right|150px|'''Equation 1: The Hill equation for a repressor.''' M is the maximal rate of transcription, [R] is the concentration of unbound repressor, K<sub>d</sub> is the dissociation constant | + | [[Image:HillRepgraph.png|thumb|left|600px|'''Graph of the Hill equation for a repressor with Hill coefficients of 1, 2, and 4.''']][[Image:HillRep.png|thumb|right|150px|'''Equation 1: The Hill equation for a repressor.''' M is the maximal rate of transcription, [R] is the concentration of unbound repressor, K<sub>d</sub> is the dissociation constant (equal to the repressor concentration that yields half the maximal transcription rate), and n is the Hill coefficient.]][[Image:linebreak.png]] |
[[Image:HillActgraph.png|thumb|left|600px|'''Graph of the Hill equation for an activator with Hill coefficients of 1, 2, and 4.''' ]] | [[Image:HillActgraph.png|thumb|left|600px|'''Graph of the Hill equation for an activator with Hill coefficients of 1, 2, and 4.''' ]] | ||
| − | [[Image:HillAct.png|thumb|150px|right|'''Equation 2: The Hill equation for an activator.'''M is the maximal rate of transcription, [A] is the concentration of unbound activator, K<sub>d</sub> is the dissociation constant | + | [[Image:HillAct.png|thumb|150px|right|'''Equation 2: The Hill equation for an activator.'''M is the maximal rate of transcription, [A] is the concentration of unbound activator, K<sub>d</sub> is the dissociation constant (equal to the activator concentration that yields half the maximal transcription rate), and n is the Hill coefficient.]] |
[[Image:linebreak.png]] | [[Image:linebreak.png]] | ||
| − | In the graphs above, three things should be noted. First, when K<sub>b</sub> is equal to [R] or [A] (meaning that [R]/K<sub>b</sub> or [A]/K<sub>b</sub> equals 1), the rate of transcription is equal to half of the maximal value (M/2). This trend is denoted by the dotted line. Second, graphs of activators and repressors with a Hill coefficient of 1 are described by the Michaelis-Menten model (not | + | In the graphs above, three things should be noted. First, when K<sub>b</sub> is equal to [R] or [A] (meaning that [R]/K<sub>b</sub> or [A]/K<sub>b</sub> equals 1), the rate of transcription is equal to half of the maximal value (M/2). This trend is denoted by the dotted line. Second, graphs of activators and repressors with a Hill coefficient of 1 are described by the Michaelis-Menten model (which does not take cooperativity into account). Therefore, the Hill equation curves for n = 1 also represent the curves for the two relatively simple equations derived earlier in this section. Third, as n increases, the curves develop more and more [http://en.wikipedia.org/wiki/Sigmoid_function sigmoidal] (S-shaped) character, where the curves converge to a minimum and maximum values asymptotically. In the next section, this sigmoidal shape will be shown to be crucial in the establishment of bistability in a memory network. |
==The Monod-Wymann-Changeux Equation== | ==The Monod-Wymann-Changeux Equation== | ||
| Line 78: | Line 78: | ||
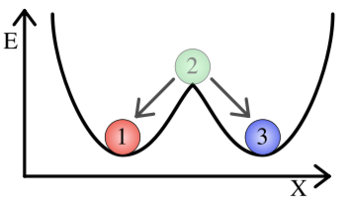
[[Image:Cooperativity.png|thumb|350px|right|'''Cooperativity of binding leads to a bistable system.'''.]] | [[Image:Cooperativity.png|thumb|350px|right|'''Cooperativity of binding leads to a bistable system.'''.]] | ||
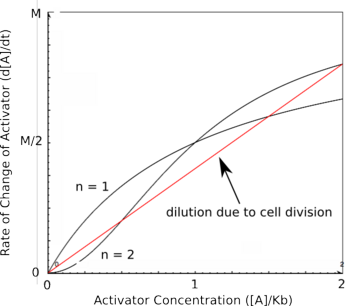
| − | Using the Hill equations above to describe the rates of protein synthesis based on different levels of repressor/activator | + | Using the Hill equations above to describe the rates of protein synthesis based on different levels of repressor/activator along with a new equation for the rate of protein decay (that arises from protein degradation and from dilution due to cell division), one can determine where the stable steady states of a given system lie. The black curves on the graph to the right represent two activators with different Hill coefficients and are similar to the graphs shown above. The red line shows the rate of protein dilution due to cell division. Because the dilution rate is so high relative to degradation in most cells, the effects of protein degradation are typically minimal in comparison. The slope of this line can be obtained from the equation: |
[[Image:Pdecay.png|200px]] | [[Image:Pdecay.png|200px]] | ||
| − | where t is the rate of cell division. The points where the protein decay curve intersects the protein production curves are the steady states of the systems. Because of the sigmoidal shape of the curve with a Hill coefficient of 2, the protein decay curve intersects it at 3 different points. The curve with a Hill coefficient of 1 (and thus no cooperativity) is only intersected twice by the protein decay curve. | + | where t is the rate of cell division. At any given value of activator concentration, if the decay rate is higher than the production rate, then the cell will move left along the x-axis (decrease [A]) until it reaches a steady state. If the production rate is higher than the decay rate, then the cell will move right along the x-axis (increase [A]) until it reaches a steady state. The points where the protein decay curve intersects the protein production curves are the steady states of the systems. Because of the sigmoidal shape of the curve with a Hill coefficient of 2, the protein decay curve intersects it at 3 different points. The curve with a Hill coefficient of 1 (and thus no cooperativity) is only intersected twice by the protein decay curve. The stable steady states are steady states at which small fluctuations in activator concentration will not move the cell into a different steady state. Looking at these two graphs, it can be seen that the curve with a Hill coefficient of 2 has stable steady states at [A]/K<sub>b</sub> of 0 and 2. The curve with a Hill coefficient of 1 has only one stable steady state at [A]/K<sub>b</sub> of about 1.5. Thus, bistability of the system is dependent on the cooperativity of binding of the activator. The same is true of the mutual repression model, however, an example is not shown here. |
[[Image:linebreak.png]] | [[Image:linebreak.png]] | ||
Latest revision as of 19:23, 6 December 2007
Main Page | Biological Designs | Mathematical Models | Toggle Switch | Hysteresis | Permanent Memory | Conclusions | References
|


