Difference between revisions of "Paul"
(→Paul's Notes) |
|||
| (4 intermediate revisions by the same user not shown) | |||
| Line 104: | Line 104: | ||
3. Merge this comparison with the known gene information. | 3. Merge this comparison with the known gene information. | ||
4. Compare gene expression differences. Some differences could be due to parent-specific imprinting. | 4. Compare gene expression differences. Some differences could be due to parent-specific imprinting. | ||
| + | |||
| + | |||
| + | GO pathway enrichment analysis | ||
| + | |||
| + | Workflow to get set of genes that are all upregulated --> GO will figure out if they organize into common functions and such. keep working on this | ||
| + | |||
| + | |||
| + | ---- | ||
| + | 4/4/17 | ||
| + | |||
| + | Gene Ontology Investigation: Do the significantly differentially expressed genes between maternal trisomic and paternal trisomic have gene organizational patterns? | ||
| + | |||
| + | Steps: | ||
| + | |||
| + | 1. MT vs PT DeSeq2 Filtered for p-value <0.01 and LFC > 0 (separate upregulated and downregulated genes) | ||
| + | 2. Remove Ensembl ID decimals | ||
| + | 3. Input into MGI to change ensembl to common gene name | ||
| + | 4. input list to Gene Ontology Consortium | ||
| + | |||
| + | Results (see Gene Ontology Folder) | ||
| + | |||
| + | Upregulated in Maternal Trisomic vs Paternal Trisomic | ||
| + | |||
| + | |||
| + | 4/11/17 | ||
| + | |||
| + | Producing GO graphs with important terms (over fold enrichment value of 2). I made graphs with the GO terms (MF, BP, and CC) for all downregulated (MT/PT) genes, but not upregulated genes. Should I plan on putting all the genes into the graphs? How much info is too much? Any way to consolidate the data would be very helpful. I could make a larger graph including both positive and negative | ||
| + | |||
| + | 4/13/17 | ||
| + | |||
| + | Need to produce GO graphs for upregulated MT/PT, as well as graphs for upregulated and downregulated M WT / P WT (as a control). I will be able to hand pick genes (or more easily: pathways) which appear enriched in both the trisomic test and the control test. This shows which pathways are especially upregulated in the trisomic mouse model versus pathways which are normally differentially regulated between the two genetic backgrounds. This is useful because the goal of our project is to characterize the gene expression differences between the paternal trisomic and maternal trisomic mice. | ||
| + | |||
| + | For continued analysis: Complete same GO analysis between Maternal/Paternal WT | ||
Latest revision as of 14:57, 13 April 2017
Paul's Notes
Understanding the Galaxy Data:
We care about: Fold Change, P-value
Think about total gene expression values and gene functions. Be aware that large gene expression values can be paired with low fold change, but that cn still be significant.
In the data input, the first data set (numerator) and second data set (denominator) order is important to sign of fold change.
Possible tests: M WT vs P WT, disomic vs trisomic
truncation for excel ensembl gene numbers: =left(A1,18)
Potentially helpful DEseq paper: http://genomebiology.biomedcentral.com/articles/10.1186/gb-2010-11-10-r106
https://www.bioconductor.org/packages/release/bioc/vignettes/DESeq2/inst/doc/DESeq2.pdf
DEseq2: uses negative binomial distribution to model gene expression "We assume that the number of reads in sample j that are assigned to gene i can be modeled by a negative binomial (NB) distribution, Kij~NB(μij,σ2ij)"
Goals for Data Analysis and Representation:
1. Determine Control Differential Expression Between Maternal Paternal (no need to extensively analyze) 2. Subtract the control differences from the experimental differences between Trisomic
2/10/17
Uploaded UCSC Mouse Genome Databases (knownGenome and EnsembltoKnown into Galaxy) Joined Deseq2 data sheets with both UCSC datasets. This allowed me to translate the Ensembl name into the UCSC name, and join the UCSC name with all the important information about the genes, particularly location on each chromosome.
Within this large dataset, I cannot figure out how to sort by both chromosome and chromosomal location. Maybe location first, chromosome second.
2/15/17
Ran Deseq2 for all 6 Trisomic vs all 6 WT.
2/20/17
I isolated the chromosome 16 and 17 Deseq2 data and sorted by location. I created a scatterplot with the data and was able to see the uniform increase in expression at the trisomic locations of the Down Syndrome mouse model chromosome 16/17.
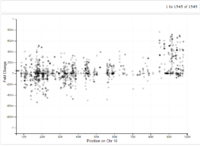
The following figure shows expression differences on chromosome 16. The known breakpoint where the trisomic part of chromosome 16 begins is 84,350,000 bp, which is where expression becomes universally upregulated. The approximate upregulation (log2) is 0.5. This means expression roughly increases 1.5 times, which makes sense if it is a trisomic region.

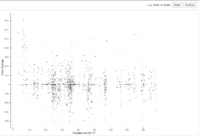
The following figure shows the same data but for chromosome 17 where the breakpoint is at the beginning of the chromosome up to 9,400,000 bp. This is also clear in the differential expression data.
Chromosome 10 Differential Expression
Papers cited by Letourneau with LAD data:
Guelen, L. et al. Domain organization of human chromosomes revealed by mapping of nuclear lamina interactions. Nature 453, 948–951 (2008).
Peric-Hupkes, D. et al. Molecular maps of the reorganization of genome-nuclear lamina interactions during differentiation. Mol. Cell 38, 603–613 (2010).
Relevance of Gene Imprinting to Our Study
Our parent of origin differential expression characterization could include imprinting in two ways:
             1.  Some of the genes on MMU 17^16 are imprinted by either the mother or father depending on the source
             2. Some of the genes on MMU17^16 are responsible for imprinting on other chromosomes. (less relevant to our study, because there would be no difference between the two parents of origin unless such a regulator itself was imprinted)
Plan:
1. Isolate list of known genes on the trisomic MMU17^16 chromosome: Filter UCSC known gene list from Chromosome 16 to genes after base pair 84,351,351 (by transcription start site). Do the same for Chr 17 for genes from beginning until base pair 9,426,822 (by transcription end site). Merge both data sets. 2. Run DESeq2 between paternal trisomic versus maternal trisomic. 3. Merge this comparison with the known gene information. 4. Compare gene expression differences. Some differences could be due to parent-specific imprinting.
GO pathway enrichment analysis
Workflow to get set of genes that are all upregulated --> GO will figure out if they organize into common functions and such. keep working on this
4/4/17
Gene Ontology Investigation: Do the significantly differentially expressed genes between maternal trisomic and paternal trisomic have gene organizational patterns?
Steps:
1. MT vs PT DeSeq2 Filtered for p-value <0.01 and LFC > 0 (separate upregulated and downregulated genes) 2. Remove Ensembl ID decimals 3. Input into MGI to change ensembl to common gene name 4. input list to Gene Ontology Consortium
Results (see Gene Ontology Folder)
Upregulated in Maternal Trisomic vs Paternal Trisomic
4/11/17
Producing GO graphs with important terms (over fold enrichment value of 2). I made graphs with the GO terms (MF, BP, and CC) for all downregulated (MT/PT) genes, but not upregulated genes. Should I plan on putting all the genes into the graphs? How much info is too much? Any way to consolidate the data would be very helpful. I could make a larger graph including both positive and negative
4/13/17
Need to produce GO graphs for upregulated MT/PT, as well as graphs for upregulated and downregulated M WT / P WT (as a control). I will be able to hand pick genes (or more easily: pathways) which appear enriched in both the trisomic test and the control test. This shows which pathways are especially upregulated in the trisomic mouse model versus pathways which are normally differentially regulated between the two genetic backgrounds. This is useful because the goal of our project is to characterize the gene expression differences between the paternal trisomic and maternal trisomic mice.
For continued analysis: Complete same GO analysis between Maternal/Paternal WT
