JP Feb 02 16
From GcatWiki
Revision as of 18:44, 4 February 2016 by Jupreziosi (talk | contribs)
80-90 % of the overexpressed sequences were mitochondrial DNA or rDNA.
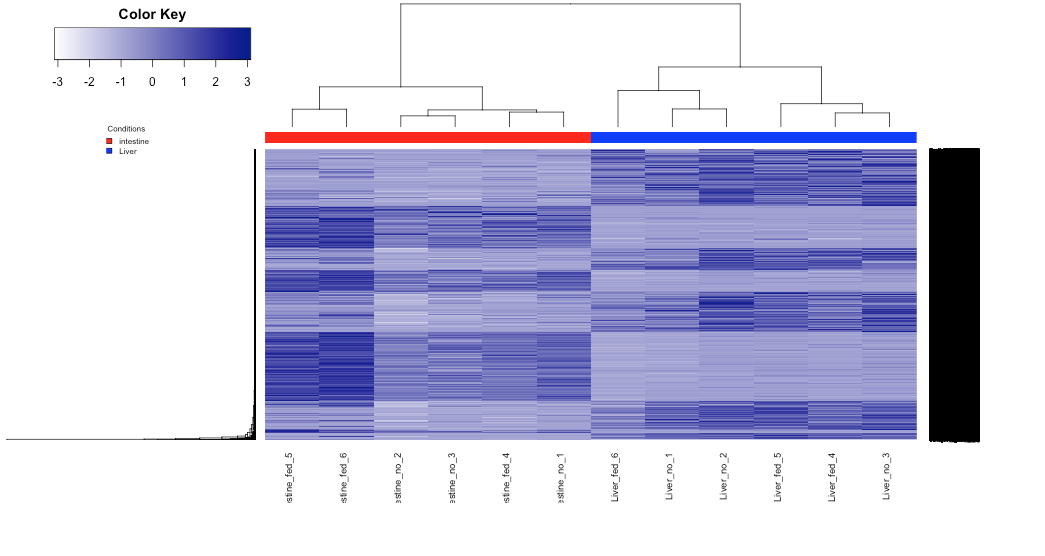
Liver and intestine look distinct.
Fed and non feds are not clustered within their group. Clustered by every gene - maybe not best way to cluster the samples.
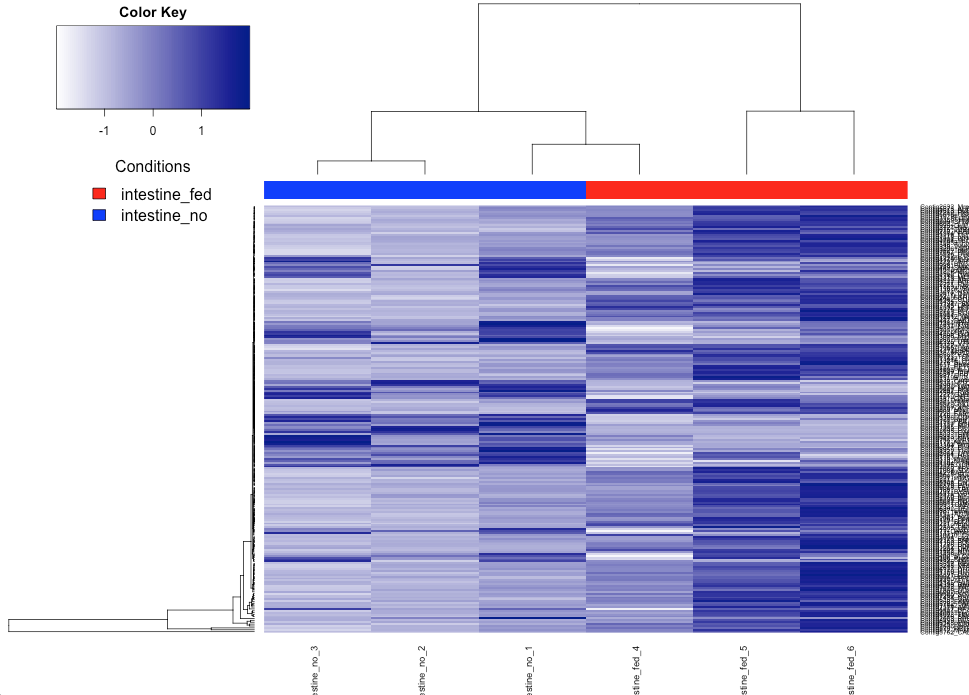
Comparison of intestine Fed & Non-Fed:

