Notes 3/8/16
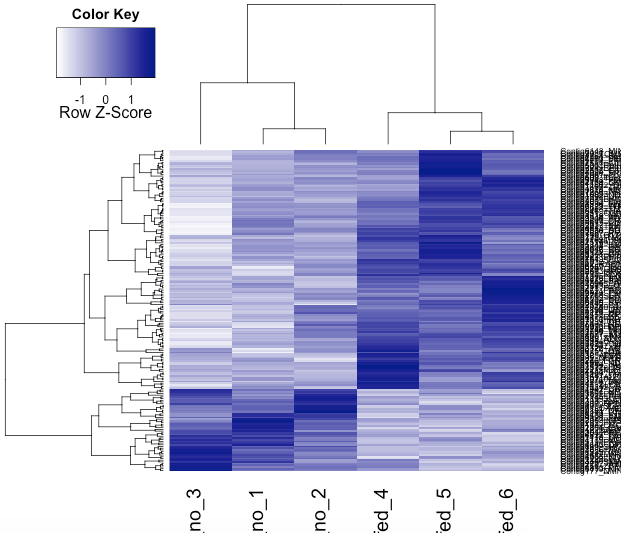
Dr. Campbell gave us a new R code that was essentially the same but included normalized aspect that was supposed to help with clustering. When I included qval < .05 showed correct clustering but list of genes was very long.

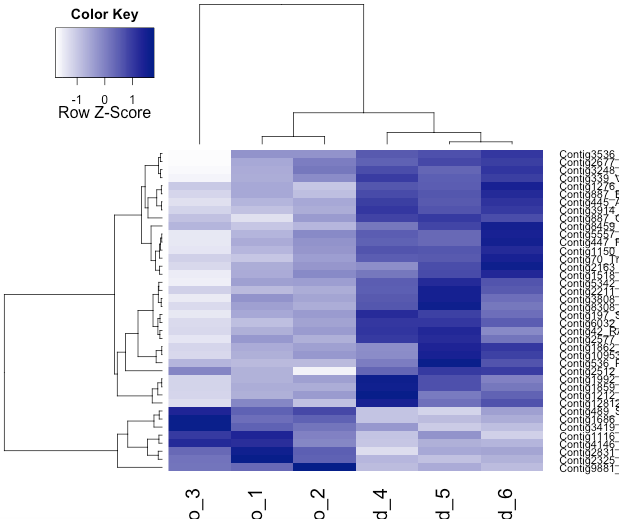
Decided to do qval < .01 like I had before. found clustering was not exact but looked pretty good using z score (KEPT THESE 40 GENES TO LOOK AT)

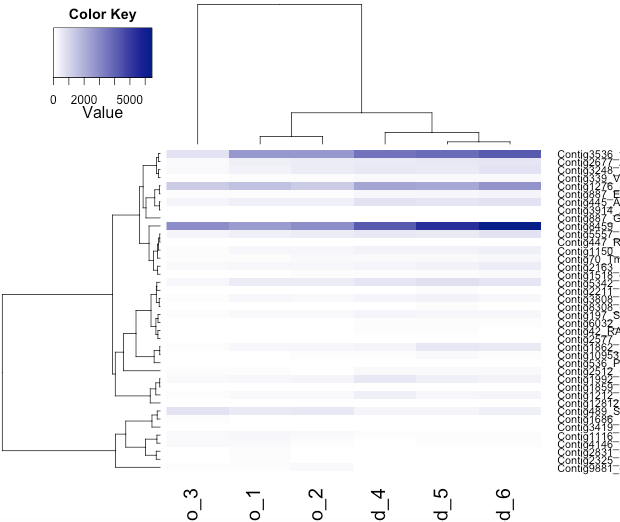
Doing the same thing but using number scale saw that there wasn't huge differences in the expression of the genes in the two groups.

MOVING FORWARD
Moving forward decided to use the list of 40 genes. Decided that we would cross reference these 40 genes with the genes found in Castoe at 6 hours
- genes on both would show differential expression early on and throughout the digestion process. List from Castoe is all unregulated so would need to see if ours were also unregulated or down regulated in the differential expression
- genes on only his list would not be interesting
- genes found only on our list might possibly be interesting because they could be involved in initiation and be back to regular levels by 6 hours
After comparing will look first at the genes on both lists to see their function and if they might be interesting, then will look at functions on the genes on our lists.
Later will run supervised clustering with these genes of interest.