Paul
Paul's Notes
Understanding the Galaxy Data:
We care about: Fold Change, P-value
Think about total gene expression values and gene functions. Be aware that large gene expression values can be paired with low fold change, but that cn still be significant.
In the data input, the first data set (numerator) and second data set (denominator) order is important to sign of fold change.
Possible tests: M WT vs P WT, disomic vs trisomic
truncation for excel ensembl gene numbers: =left(A1,18)
Potentially helpful DEseq paper: http://genomebiology.biomedcentral.com/articles/10.1186/gb-2010-11-10-r106
https://www.bioconductor.org/packages/release/bioc/vignettes/DESeq2/inst/doc/DESeq2.pdf
DEseq2: uses negative binomial distribution to model gene expression "We assume that the number of reads in sample j that are assigned to gene i can be modeled by a negative binomial (NB) distribution, Kij~NB(μij,σ2ij)"
Goals for Data Analysis and Representation:
1. Determine Control Differential Expression Between Maternal Paternal (no need to extensively analyze) 2. Subtract the control differences from the experimental differences between Trisomic
2/10/17
Uploaded UCSC Mouse Genome Databases (knownGenome and EnsembltoKnown into Galaxy) Joined Deseq2 data sheets with both UCSC datasets. This allowed me to translate the Ensembl name into the UCSC name, and join the UCSC name with all the important information about the genes, particularly location on each chromosome.
Within this large dataset, I cannot figure out how to sort by both chromosome and chromosomal location. Maybe location first, chromosome second.
2/15/17
Ran Deseq2 for all 6 Trisomic vs all 6 WT.
2/20/17
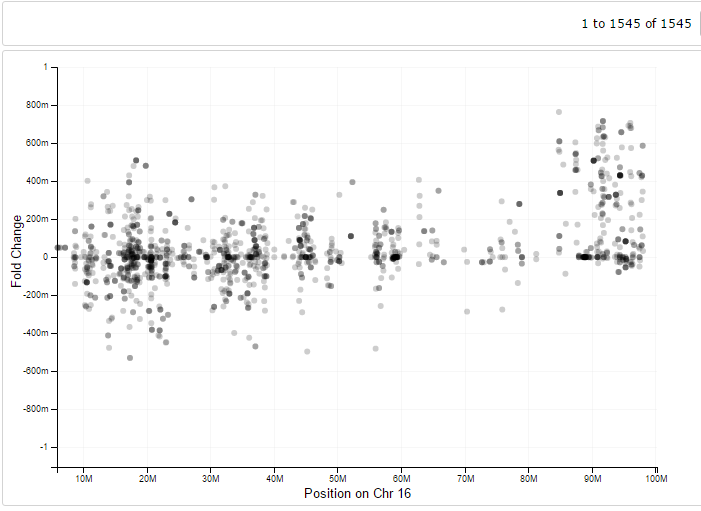
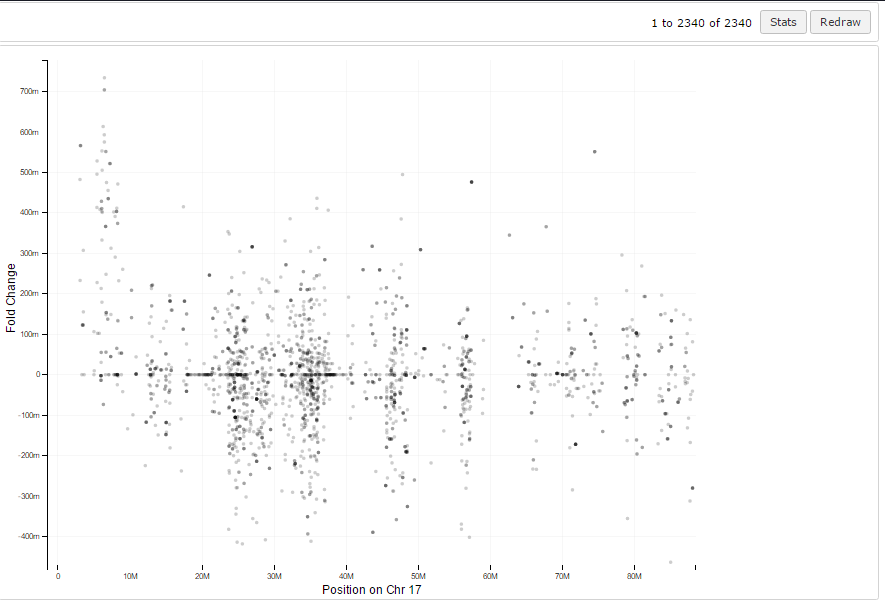
I isolated the chromosome 16 and 17 Deseq2 data and sorted by location. I created a scatterplot with the data and was able to see the uniform increase in expression at the trisomic locations of the Down Syndrome mouse model chromosome 16/17.
The following figure shows expression differences on chromosome 16. The known breakpoint where the trisomic part of chromosome 16 begins is 84,350,000 bp, which is where expression becomes universally upregulated. The approximate upregulation (log2) is 0.5. This means expression roughly increases 1.5 times, which makes sense if it is a trisomic region.

The following figure shows the same data but for chromosome 17 where the breakpoint is at the beginning of the chromosome up to 9,400,000 bp. This is also clear in the differential expression data.
