Difference between revisions of "Synergy Machine Protocol"
From GcatWiki
| Line 19: | Line 19: | ||
# Note- if only a few wells give a value of OVRFLW, try lowering the gain from 100 to 95 or 90 (or lower if necessary). Enter the value on the page with the wavelengths for fluorescence. If all wells give a value of OVRFLW, this means the wavelengths are too close together. Try increasing the difference between the excitation and emission wavelengths. | # Note- if only a few wells give a value of OVRFLW, try lowering the gain from 100 to 95 or 90 (or lower if necessary). Enter the value on the page with the wavelengths for fluorescence. If all wells give a value of OVRFLW, this means the wavelengths are too close together. Try increasing the difference between the excitation and emission wavelengths. | ||
#[[File:Optimal GFP.PNG]] | #[[File:Optimal GFP.PNG]] | ||
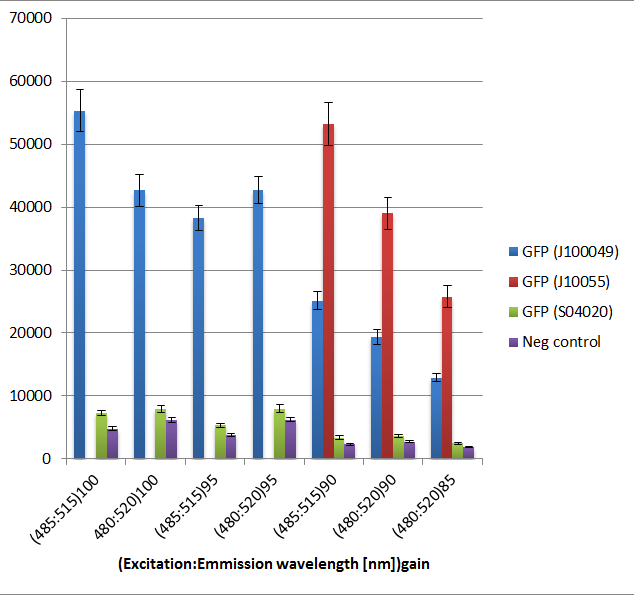
| + | ## 485 nm/515 nm (100 gain) are the optimal exitation/emission wavelengths for use with GFP. | ||
#[[File:CaptureRFP.PNG]] | #[[File:CaptureRFP.PNG]] | ||
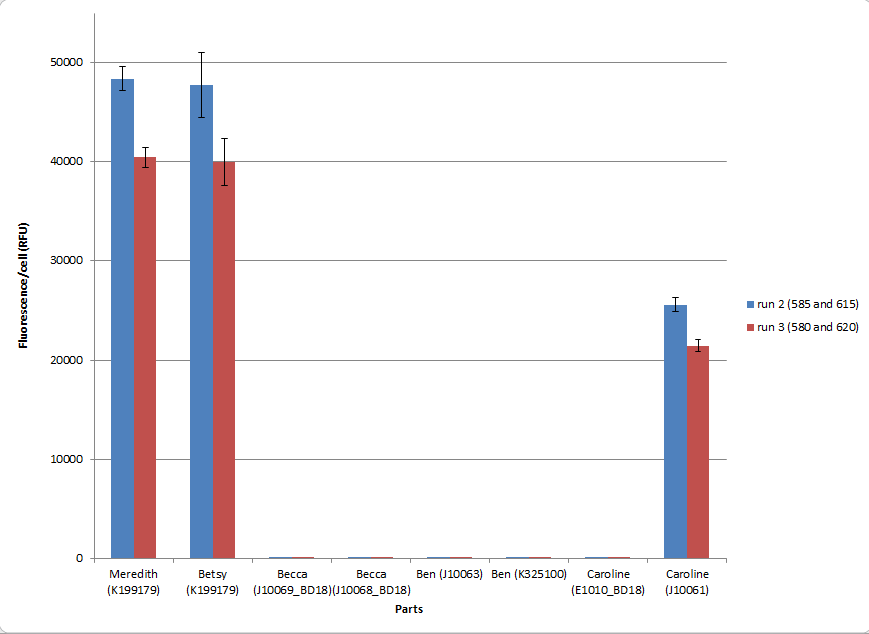
##585 nm/615 nm (100 gain) are the optimal excitation/emission wavelengths for use with RFP, as they resulted in the highest fluorescence readings. | ##585 nm/615 nm (100 gain) are the optimal excitation/emission wavelengths for use with RFP, as they resulted in the highest fluorescence readings. | ||
#[[File:Line_Graph_GFP.PNG]] | #[[File:Line_Graph_GFP.PNG]] | ||
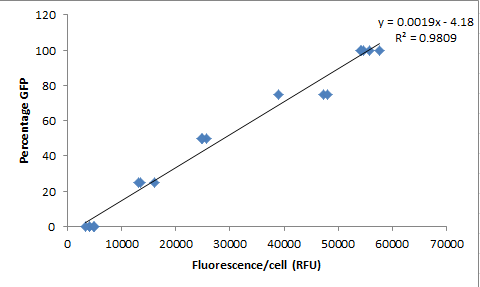
| + | ## This graph is for use with extrapolating data. Taking fluorescence per cell, measured with GFP wavelengths, and plugging that value into the equation should give you an estimate of the percentage of GFP in your sample. | ||
#[[File:Line Graph RFP.PNG]] | #[[File:Line Graph RFP.PNG]] | ||
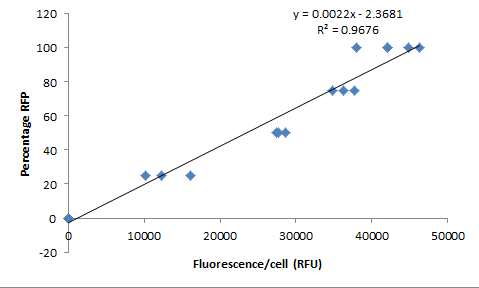
| + | ## This graph is for use with extrapolating data. Taking fluorescence per cell, measured with RFP wavelengths, and plugging that value into the equation should give you an estimate of the percentage of RFP in your sample. | ||
Revision as of 18:55, 6 June 2012
Synergy Machine Protocol
- Open Gen 5 software
- Click on Existing protocol OR move to step 3
- Click on Create New Protocol
- Select Standard Protocol type
- Click on Procedure
- Under Shake, select Orbital Shake for 3 seconds
- Under Read, select Fluorescence from drop down menu
- Enter Emission and Excitation wavelengths
- If you are reading more than one type of fluorescence, click the appropriate number of types above the wavelength values.
- For RFP, select 585 nm (excitation) and 615 nm (emission) for optimal reading (with 100 gain)
- For GFP, select 485 (excitation) and 515 (emission) for optimal reading (with 100 gain)
- Enter Emission and Excitation wavelengths
- Under Read, select Absorbance from the drop down menu and enter 590 nm
- Once those values have been submitted, drag tasks into proper order. First Shake, then read Fluorescence, then read Absorbance.
- If you are measuring GFP and RFP, measure GFP before RFP.
- Click OK, and from the banner menu, select File, New Task, then Read Now (selecting the procedure you created)
- Place the well inside the machine, and Click OK when ready.
- After the machine has run, you can export the data to Excel using the Excel button on the banner of the window that pops up.
- Note- if only a few wells give a value of OVRFLW, try lowering the gain from 100 to 95 or 90 (or lower if necessary). Enter the value on the page with the wavelengths for fluorescence. If all wells give a value of OVRFLW, this means the wavelengths are too close together. Try increasing the difference between the excitation and emission wavelengths.
- 485 nm/515 nm (100 gain) are the optimal exitation/emission wavelengths for use with GFP.
- 585 nm/615 nm (100 gain) are the optimal excitation/emission wavelengths for use with RFP, as they resulted in the highest fluorescence readings.
- This graph is for use with extrapolating data. Taking fluorescence per cell, measured with GFP wavelengths, and plugging that value into the equation should give you an estimate of the percentage of GFP in your sample.
- This graph is for use with extrapolating data. Taking fluorescence per cell, measured with RFP wavelengths, and plugging that value into the equation should give you an estimate of the percentage of RFP in your sample.


