JP Mar 10 16
From GcatWiki
Revision as of 19:51, 10 March 2016 by Jupreziosi (talk | contribs)
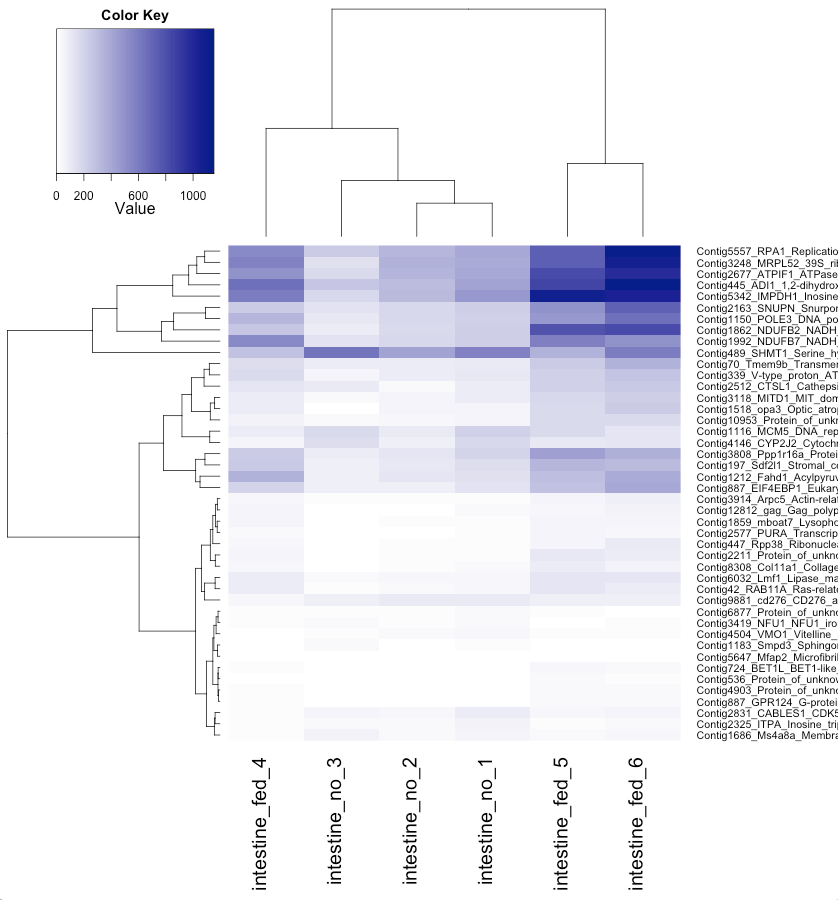
Below is a graph that we generated using "Supervised Clustering" R file by Heyer and Campbell. The mean expression is changed to 1 and 1000, the values to 0.01 and 0.01.
From this we generated a list of 44 genes of interest.
We then assigned them GO terms as possible from the contig to GO term list.
We used our POUF converter to assign names to the proteins of unknown function of interest.
We then tried to find GO terms for those not on the list.
