Background Information:
Kyte-Doolittle, Amino Acids, Examples
1. Kyte-Doolittle Hydropathy Plot
Kyte-Doolittle hydropathy plots are extremely useful to biologists who are interested in studying the hydrophilicity/hydrophobicity of a protein because this can help determine the location and the function of the protein. Each amino acid in the protein sequence is given a numeric score, according to how hydrophilic or hydrophobic it is. This measure of hydrophilicity/hydrophobicity is called hydropathy. These scores range from approximately -4.5 to +4.5. The more negative the score, the more hydrophilic the single amino acid is, and the more positive the score, the more hydrophobic. For example, the extremely hydrophilic amino acid, Arginine, has a hydropathy score of -4.5, while the extremely hydrophobic amino acid, Isoleucine, has a hydropathy score of +4.5.
Once each amino acid in the sequence is given a numeric value, a Kyte-Doolittle hydropathy plot can be created. This plot is made using the x-axis to signify the amino acid position and the y-axis to signify the hydropathy score. For each amino acid position, an average is taken of that amino acid's hydropathy score plus a certain number of amino acid scores following in the sequence. The number of amino acid scores averaged is determined by the window size. For example, if the window size is 9, then the amino acid of interest plus the next 8 amino acids are added, and then the total score is divided by 9. The average is then the y-value for that particular amino acid. A similar process is carried out for the remainder of the amino acids, until there are not enough amino acids at the end of the sequence to fulfill the window size requirement. That is then the end of the x-axis amino acid positions.
 |
Above is a typical Kyte-Doolittle hydropathy plot. If the plot shows that there is a region that is significantly hydrophobic, then this area is likely to fold upon itself and incorporate itself into a cell membrane. Most protein sequences are much longer than the above example, though, so it is possible to have several hydrophobic and several hydrophilic regions in the same protein. Typically, any regions above the threshold line of 2 is hydrophobic enough to fold back upon itself.
2. Amino acid information
Amino acids are the building blocks or proteins, which consist of a long string or strings of amino acids bonded together by peptide bonds in an order specified by DNA. The order of amino acids is essential to the structure, and therefore function of the protein as each amino acid has a specific charge and shape that determines its interactions with other molecules. When the peptide chain of amino acids has been produced in the cell, the protein begins to take on shape and is processed and modified in different parts of the cell. Because of the protein's shape and structure, the cell knows where to send the protein.
|
|
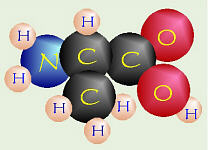
Amino acids are built from a central carbon bonded to four different groups.hydrogen (-H),
|
Because each amino acid has a specific charge, the Kyte-Doolitle hydropathy analysis can assign each amino acid a specific numeric value and analyze regions of a protein using this index. Biologists are interested in this type of analysis, because they can reveal exceptionally hydrophobic regions of a protein which indicates the probable cellular location of the protein in the cell membrane. In eukaryotes, the cell membrane consists of a lipid bi-layer that can only be penetrated by hydrophobic molecules. Therefore, if the Kyte-Doolittle analysis reveals that a group of amino acids are particularly hydrophobic, we can logically conclude that part of the protein functions in the cell membrane.
3. Examples
In order to provide a model for the usage of this page, we have included examples of plotting a certain sequence using a few different window sizes. To find amino acid sequences, we recommend using a databank such as GENBANK. The National Center for Biotechnology Information, which can be found on our links page, allows a user to search various databases, such as genbank, for specific DNA or amino acid sequences in various organisms.
The protein sequence analyzed is a 100 amino long region at the beginning of the YNL037C/IDH1 gene in Saccharomyces cerevisiae. This gene functions in making proteins for the citric acid cycle in common baker's yeast.
1 MLNRTIAKRT LATAAQAERT LPKKYGGRFT VTLIPGDGVG KEITDSVRTI
51 FEAENIPIDW ETINIKQTDH KEGVYEAVES LKRNKIGLKG LWHTPADQTG
Plotting this strand using a window size of 5 produces the following graph:
As we can see, this strand seems to contain many variations in hydrophobicity, but we notice an overall hydrophilicity, as the median of the graph looks to be below zero. We notice highly hydrophobic regions around 10 and 30, and highly hydrophilic regions around 16-25,67-69, and 78-84.
In order to refine our plot to show hydrophobicity of larger regions of our sequence, we increase the window size to 9 and get the following graph:
Here, we see highly hydrophilic regions from 14-25 and 61-70, as well as an overall hydrophilicity throughout the graph, as the median of the graph again appears to fall well below zero. We do see a few hydrophobic regions in the areas of characters 27-32, as well as spikes of hydrophobicity around characters 43, 51, and 74.
Again, we wish to generalize the hydrophobicity of the strand even further, in order to show the overall hydrophobicity of even larger sections of the strand, so we increase our window size to 17, which produces the following graph:
Again, the graph suggests an overall hydrophilicity, with the more severely hydrophilic regions occurring around 8-18, 52-72, and 78-85. The only slightly hydrophobic region seems to occur around characters 27-32.
Another way of changing our plot is to change the length of the strand. We now use only the first 50 characters of the strand and return to a window size of 5, producing the following graph:
As in each previous try, we see overall hydrophilicity in the strand, with regions of higher hydrophilicity in the areas of 14-24, and 3 spikes of hydrophilicity from 36-46. We do now notice two regions of hydrophobicity around 10 and 30, which appear to be significantly large.
We can now see that, by varying the length of the strand and the window size, we can find the hydrophobicity of any size of region on any point on our amino acid sequence.
email the authors: Amber Hartman, Peter Leese, Talbot Presley, and Lang Robertson